Circle Correlation Graphs: Effective Sample Visualization
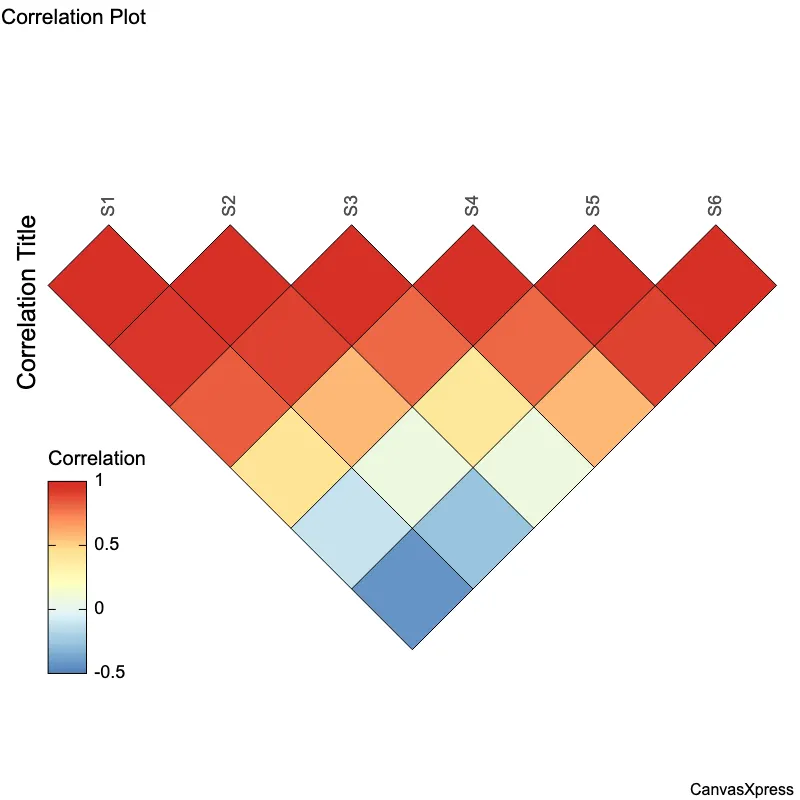
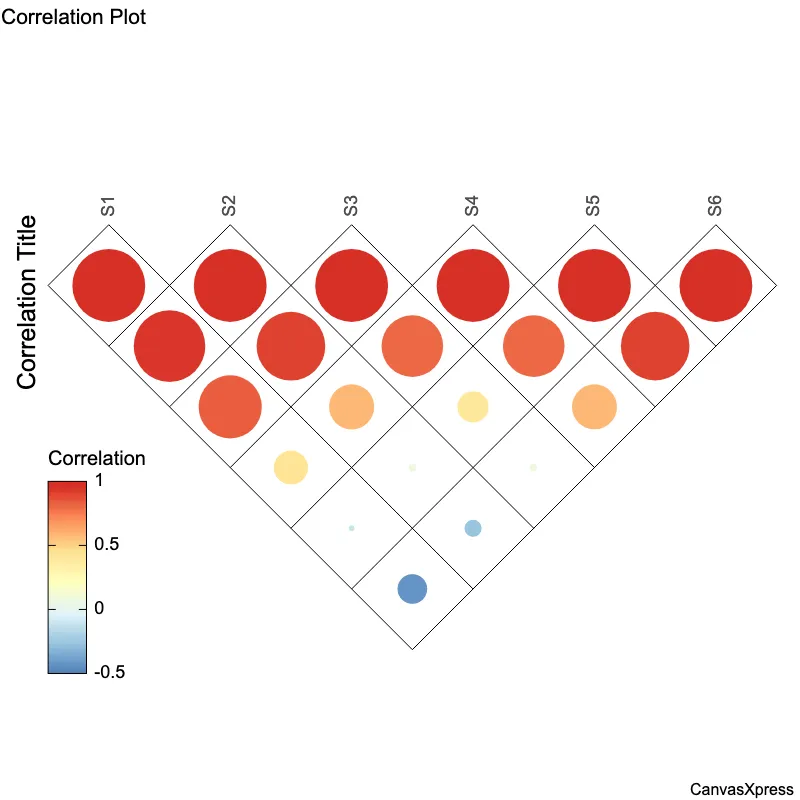
Correlation graphs are visual representations of the relationship between two or more variables. They help identify trends and patterns, showing whether variables move together (positive correlation), in opposite directions (negative correlation), or have no relationship (no correlation). Common types include scatter plots and line graphs. Understanding correlation graphs is crucial for data analysis across various fields. From finance and economics to science and healthcare, they provide insights into dependencies and potential predictions. Interpreting the strength and direction of correlation is key to making informed decisions based on data. Effective visualization ensures clear communication of complex relationships.


<html>

  <head>
    <!-- Include the CanvasXpress library in your HTML file -->
    <link rel="stylesheet" href="https://www.canvasxpress.org/dist/canvasXpress.css" type="text/css"/>
    <script src="https://www.canvasxpress.org/dist/canvasXpress.min.js"></script>
  </head>

  <body>

    <!-- Create a canvas element for the chart with the desired dimensions -->
    <div>
      <canvas id="canvasId" width="600" height="600"></canvas>
    </div>


    <!-- Create a script to initialize the chart -->
    <script>

      // Use a data frame (2D-array) for the graph
      var data = [
        [ "Id", "V1", "V2", "V3", "V4", "Factor4", "Factor6", "Factor3", "Factor1", "Factor2", "Factor5"],
        [ "S1", 5, 95, 25, 55, 5, 10, "Lev : X", "Lev : 1", "Lev : A", 8],
        [ "S2", 10, 80, 30, 40, 10, 20, "Lev : X", "Lev : 2", "Lev : B", 16],
        [ "S3", 25, 75, 45, 35, 15, 30, "Lev : Y", "Lev : 3", "Lev : A", 24],
        [ "S4", 40, 70, 60, 30, 20, 40, "Lev : Y", "Lev : 1", "Lev : B", 32],
        [ "S5", 45, 55, 65, 15, 25, 50, "Lev : Z", "Lev : 2", "Lev : A", 40],
        [ "S6", 50, 40, 70, 1, 30, 60, "Lev : Z", "Lev : 3", "Lev : B", 48 ]
      ];

      // Create the configuration for the graph
      var config = {
         "correlationAxis" : "samples",
         "correlationType" : "circle",
         "graphType" : "Correlation",
         "title" : "Correlation Plot",
         "yAxisTitle" : "Correlation Title",
         "xAxis": ["V1","V2","V3","V4"]
      }

      // Event used to create graph (optional)
      var events = false

      // Call the CanvasXpress function to create the graph
      var cX = new CanvasXpress("canvasId", data, config, events);

    </script>

  </body>

</html>
<html>

  <head>
    <!-- Include the CanvasXpress library in your HTML file -->
    <link rel="stylesheet" href="https://www.canvasxpress.org/dist/canvasXpress.css" type="text/css"/>
    <script src="https://www.canvasxpress.org/dist/canvasXpress.min.js"></script>
  </head>

  <body>

    <!-- Create a canvas element for the chart with the desired dimensions -->
    <div>
      <canvas id="canvasId" width="600" height="600"></canvas>
    </div>


    <!-- Create a script to initialize the chart -->
    <script>

      // Create the data for the graph
      var data = {
         "x" : {
            "Factor1" : ["Lev : 1","Lev : 2","Lev : 3","Lev : 1","Lev : 2","Lev : 3"],
            "Factor2" : ["Lev : A","Lev : B","Lev : A","Lev : B","Lev : A","Lev : B"],
            "Factor3" : ["Lev : X","Lev : X","Lev : Y","Lev : Y","Lev : Z","Lev : Z"],
            "Factor4" : [5,10,15,20,25,30],
            "Factor5" : [8,16,24,32,40,48],
            "Factor6" : [10,20,30,40,50,60]
         },
         "y" : {
            "data" : [
              [5,10,25,40,45,50],
              [95,80,75,70,55,40],
              [25,30,45,60,65,70],
              [55,40,35,30,15,1]
            ],
            "desc" : ["Magnitude1","Magnitude2"],
            "smps" : ["S1","S2","S3","S4","S5","S6"],
            "vars" : ["V1","V2","V3","V4"]
         },
         "z" : {
            "Annt1" : ["Desc : 1","Desc : 2","Desc : 3","Desc : 4"],
            "Annt2" : ["Desc : A","Desc : B","Desc : A","Desc : B"],
            "Annt3" : ["Desc : X","Desc : X","Desc : Y","Desc : Y"],
            "Annt4" : [5,10,15,20],
            "Annt5" : [8,16,24,32],
            "Annt6" : [10,20,30,40]
         }
      }

      // Create the configuration for the graph
      var config = {
         "correlationAxis" : "samples",
         "correlationType" : "circle",
         "graphType" : "Correlation",
         "title" : "Correlation Plot",
         "yAxisTitle" : "Correlation Title",
         "xAxis": ["V1","V2","V3","V4"]
      }

      // Event used to create graph (optional)
      var events = false

            // Call the CanvasXpress function to create the graph
      var cX = new CanvasXpress("canvasId", data, config, events);

    </script>

  </body>

</html>
library(canvasXpress)
y=read.table("https://www.canvasxpress.org/data/r/cX-generic-dat.txt", header=TRUE, sep="\t", quote="", row.names=1, fill=TRUE, check.names=FALSE, stringsAsFactors=FALSE)
x=read.table("https://www.canvasxpress.org/data/r/cX-generic-smp.txt", header=TRUE, sep="\t", quote="", row.names=1, fill=TRUE, check.names=FALSE, stringsAsFactors=FALSE)
z=read.table("https://www.canvasxpress.org/data/r/cX-generic-var.txt", header=TRUE, sep="\t", quote="", row.names=1, fill=TRUE, check.names=FALSE, stringsAsFactors=FALSE)
canvasXpress(
data=y,
smpAnnot=x,
varAnnot=z,
correlationAxis="samples",
correlationType="circle",
graphType="Correlation",
title="Correlation Plot",
xAxis=list("V1", "V2", "V3", "V4"),
yAxisTitle="Correlation Title"
)
from canvasxpress.canvas import CanvasXpress
from canvasxpress.plot import show_in_browser

if __name__ == "__main__":
  # Define the chart with its data and configuration
  chart: CanvasXpress = CanvasXpress(
    render_to = "correlation2",
    data = {
      "x": {
        "Factor1": ["Lev : 1", "Lev : 2", "Lev : 3", "Lev : 1", "Lev : 2", "Lev : 3"],
        "Factor2": ["Lev : A", "Lev : B", "Lev : A", "Lev : B", "Lev : A", "Lev : B"],
        "Factor3": ["Lev : X", "Lev : X", "Lev : Y", "Lev : Y", "Lev : Z", "Lev : Z"],
        "Factor4": [5, 10, 15, 20, 25, 30],
        "Factor5": [8, 16, 24, 32, 40, 48],
        "Factor6": [10, 20, 30, 40, 50, 60]
      },
      "y": {
        "data": [
          [5, 10, 25, 40, 45, 50],
          [95, 80, 75, 70, 55, 40],
          [25, 30, 45, 60, 65, 70],
          [55, 40, 35, 30, 15, 1]
        ],
        "desc": ["Magnitude1", "Magnitude2"],
        "smps": ["S1", "S2", "S3", "S4", "S5", "S6"],
        "vars": ["V1", "V2", "V3", "V4"]
      },
      "z": {
        "Annt1": ["Desc : 1", "Desc : 2", "Desc : 3", "Desc : 4"],
        "Annt2": ["Desc : A", "Desc : B", "Desc : A", "Desc : B"],
        "Annt3": ["Desc : X", "Desc : X", "Desc : Y", "Desc : Y"],
        "Annt4": [5, 10, 15, 20],
        "Annt5": [8, 16, 24, 32],
        "Annt6": [10, 20, 30, 40]
      }
    },
    config = {
      "correlationAxis": "samples",
      "correlationType": "circle",
      "graphType": "Correlation",
      "title": "Correlation Plot",
      "yAxisTitle": "Correlation Title",
      "xAxis": ["V1", "V2", "V3", "V4"]
    },
    width = 600,
    height = 600
  )

  # Display the chart in its own Web page
  show_in_browser(chart)

from canvasxpress.canvas import CanvasXpress
from canvasxpress.plot import graph

graph(
  CanvasXpress(
    render_to = "correlation2",
    data = {
      "x": {
        "Factor1": ["Lev : 1", "Lev : 2", "Lev : 3", "Lev : 1", "Lev : 2", "Lev : 3"],
        "Factor2": ["Lev : A", "Lev : B", "Lev : A", "Lev : B", "Lev : A", "Lev : B"],
        "Factor3": ["Lev : X", "Lev : X", "Lev : Y", "Lev : Y", "Lev : Z", "Lev : Z"],
        "Factor4": [5, 10, 15, 20, 25, 30],
        "Factor5": [8, 16, 24, 32, 40, 48],
        "Factor6": [10, 20, 30, 40, 50, 60]
      },
      "y": {
        "data": [
          [5, 10, 25, 40, 45, 50],
          [95, 80, 75, 70, 55, 40],
          [25, 30, 45, 60, 65, 70],
          [55, 40, 35, 30, 15, 1]
        ],
        "desc": ["Magnitude1", "Magnitude2"],
        "smps": ["S1", "S2", "S3", "S4", "S5", "S6"],
        "vars": ["V1", "V2", "V3", "V4"]
      },
      "z": {
        "Annt1": ["Desc : 1", "Desc : 2", "Desc : 3", "Desc : 4"],
        "Annt2": ["Desc : A", "Desc : B", "Desc : A", "Desc : B"],
        "Annt3": ["Desc : X", "Desc : X", "Desc : Y", "Desc : Y"],
        "Annt4": [5, 10, 15, 20],
        "Annt5": [8, 16, 24, 32],
        "Annt6": [10, 20, 30, 40]
      }
    },
    config = {
      "correlationAxis": "samples",
      "correlationType": "circle",
      "graphType": "Correlation",
      "title": "Correlation Plot",
      "yAxisTitle": "Correlation Title",
      "xAxis": ["V1", "V2", "V3", "V4"]
    },
    width = 600,
    height = 600
  )
)