Master small datasets with dot plots
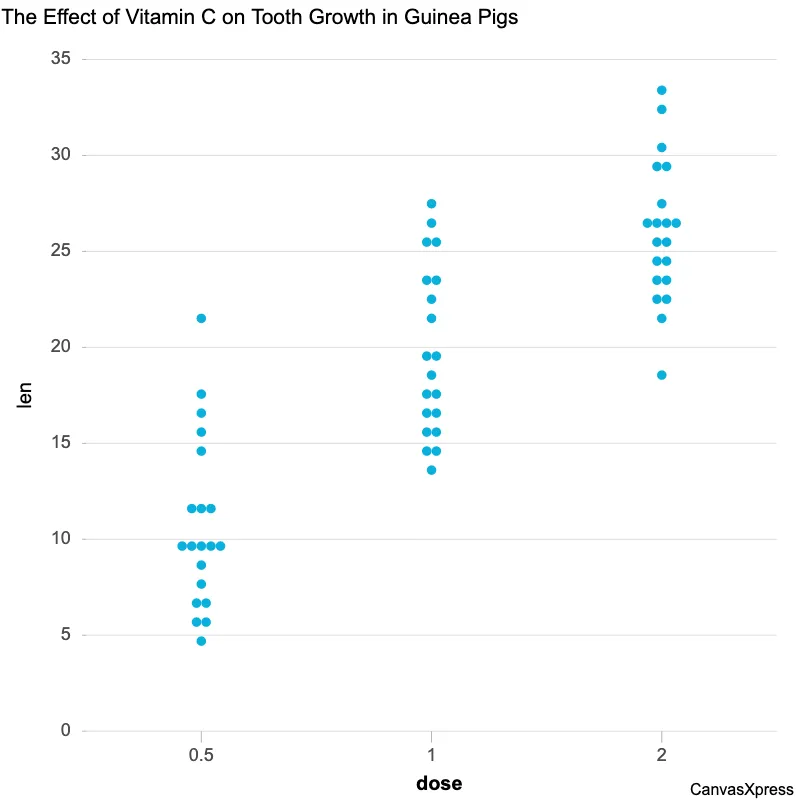
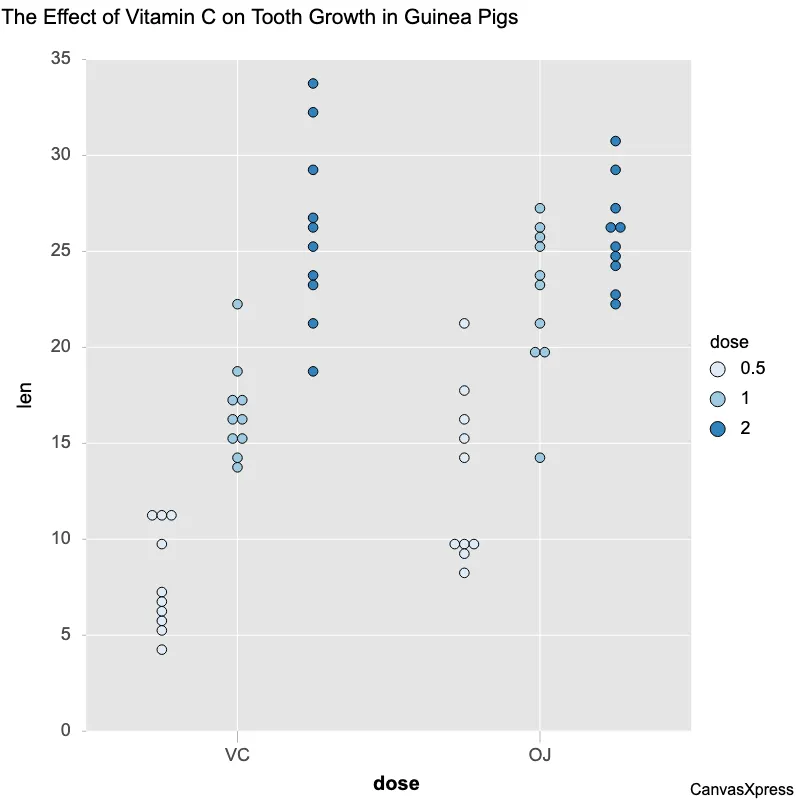
Dot plots are ideal for visualizing distributions, particularly when dealing with smaller datasets. They offer a clear and intuitive way to show the frequency of individual data points. This makes them useful for quickly identifying clusters, outliers, and the overall shape of the data. Compared to histograms, dot plots maintain the identity of each data point. This level of detail is beneficial when precise values are crucial and the sample size is not overwhelmingly large. They are easy to understand and interpret, making them a good choice for presentations and reports aimed at a broad audience.


<html>

  <head>
    <!-- Include the CanvasXpress library in your HTML file -->
    <link rel="stylesheet" href="https://www.canvasxpress.org/dist/canvasXpress.css" type="text/css"/>
    <script src="https://www.canvasxpress.org/dist/canvasXpress.min.js"></script>
  </head>

  <body>

    <!-- Create a canvas element for the chart with the desired dimensions -->
    <div>
      <canvas id="canvasId" width="600" height="600"></canvas>
    </div>


    <!-- Create a script to initialize the chart -->
    <script>

      // Use a data frame (2D-array) for the graph
      var data = [
        [ "Id", "Number", "Year", "Recognitions", "Recognized", "Winnings", "Type"],
        [ "Dutch in Seven Lessons", 1, 1948, 0, "No", 0, "Film"],
        [ "High Button Shoes", 2, 1948, 0, "No", 0, "Stage"],
        [ "Sauce Tartare", 1, 1949, 0, "No", 0, "Stage"],
        [ "Saturday Night Revue", 1, 1950, 0, "No", 0, "Television"],
        [ "Sauce Piquante", 2, 1950, 0, "No", 0, "Stage"],
        [ "One Wild Oat", 1, 1951, 0, "No", 0, "Film"],
        [ "Young Wives' Tale", 2, 1951, 0, "No", 0, "Film"],
        [ "Laughter in Paradise", 3, 1951, 0, "No", 0, "Film"],
        [ "The Lavender Hill Mob", 4, 1951, 0, "No", 0, "Film"],
        [ "Sunday Night Theatre", 5, 1951, 0, "No", 0, "Television"],
        [ "Gigi", 6, 1951, 0, "No", 0, "Stage"],
        [ "Secret People", 1, 1952, 0, "No", 0, "Film"],
        [ "Monte Carlo Baby", 2, 1952, 0, "No", 0, "Film"],
        [ "CBS Television Workshop", 3, 1952, 0, "No", 0, "Television"],
        [ "Roman Holiday", 1, 1953, 4, "Yes", 4, "Film"],
        [ "Sabrina", 1, 1954, 3, "Yes", 0, "Film"],
        [ "Ondine", 2, 1954, 1, "Yes", 1, "Stage"],
        [ "War and Peace", 1, 1956, 2, "Yes", 0, "Film"],
        [ "Love in the Afternoon", 1, 1957, 2, "Yes", 0, "Film"],
        [ "Funny Face", 2, 1957, 0, "No", 0, "Film"],
        [ "Producers' Showcase", 3, 1957, 0, "No", 0, "Television"],
        [ "Green Mansions", 1, 1959, 0, "No", 0, "Film"],
        [ "The Nun's Story", 2, 1959, 4, "Yes", 2, "Film"],
        [ "The Unforgiven", 1, 1960, 0, "No", 0, "Film"],
        [ "Breakfast at Tiffany's", 1, 1961, 2, "Yes", 0, "Film"],
        [ "The Children's Hour", 2, 1961, 0, "No", 0, "Film"],
        [ "Charade", 1, 1963, 2, "Yes", 1, "Film"],
        [ "Paris When It Sizzles", 1, 1964, 0, "No", 0, "Film"],
        // ... (data truncated after 29 records for clarity)
      ]

      // Create the configuration for the graph
      var config = {
         "backgroundImage" : "https://www.canvasxpress.org/assets/images/Audrey.jpg",
         "backgroundType" : "image",
         "colorBy" : "Type",
         "colorScheme" : "Greens",
         "graphOrientation" : "vertical",
         "graphType" : "Dotplot",
         "groupingFactors" : ["Year"],
         "isGraphTime" : true,
         "jitter" : false,
         "legendColumns" : 3,
         "legendKeyBackgroundBorderColor" : "rgba(255,255,255,0)",
         "legendKeyBackgroundColor" : "rgba(255,255,255,0)",
         "legendPosition" : "top",
         "legendTextScaleFontFactor" : 2,
         "legendTitleScaleFontFactor" : 2,
         "marginLeft" : 150,
         "marginRight" : 150,
         "objectBorderColor" : "rgba(0,0,0)",
         "showErrorBars" : false,
         "showLegendTitle" : false,
         "smpLabelInterval" : 1,
         "smpTextRotate" : 90,
         "timeFormat" : "year",
         "title" : "The Life and Films of Audrey Hepburn",
         "xAxis" : ["Number"],
         "xAxis2Show" : false,
         "xAxisGridMajorShow" : false,
         "xAxisGridMinorShow" : false,
         "xAxisShow" : false
      }

      // Event used to create graph (optional)
      var events = {
        "mousemove": function (o, e, t) {
          if (o && o.objectType && o.objectType == 'Property') {
            t.showInfoSpan(e, o.display);
          } else if (o && o.y && o.objectType != 'Smp') {
            var str = "<b>" + o.y.smps + "</b><br><b>Year: </b>" + o.y.Year + "<br><b>Type: </b>" + o.y.Type;
            t.showInfoSpan(e, str);
          }
        }
      }

      // Call the CanvasXpress function to create the graph
      var cX = new CanvasXpress("canvasId", data, config, events);

    </script>

  </body>

</html>
<html>

  <head>
    <!-- Include the CanvasXpress library in your HTML file -->
    <link rel="stylesheet" href="https://www.canvasxpress.org/dist/canvasXpress.css" type="text/css"/>
    <script src="https://www.canvasxpress.org/dist/canvasXpress.min.js"></script>
  </head>

  <body>

    <!-- Create a canvas element for the chart with the desired dimensions -->
    <div>
      <canvas id="canvasId" width="600" height="600"></canvas>
    </div>


    <!-- Create a script to initialize the chart -->
    <script>

      // Create the data for the graph
      var data = {
         "x" : {
            "Recognitions" : [0,0,0,0,0,0,0,0,0,0,0,0,0,0,4,3,1,2,2,0,0,0,4,0,2,0,2,0,2,0,1,3,0,0,0,0,0,0,0,0,1],
            "Recognized" : ["No","No","No","No","No","No","No","No","No","No","No","No","No","No","Yes","Yes","Yes","Yes","Yes","No","No","No","Yes","No","Yes","No","Yes","No","Yes","No","Yes","Yes","No","No","No","No","No","No","No","No","Yes"],
            "Type" : ["Film","Stage","Stage","Television","Stage","Film","Film","Film","Film","Television","Stage","Film","Film","Television","Film","Film","Stage","Film","Film","Film","Television","Film","Film","Film","Film","Film","Film","Film","Film","Film","Film","Film","Television","Film","Film","Film","Television","Television","Television","Film","Television"],
            "Winnings" : [0,0,0,0,0,0,0,0,0,0,0,0,0,0,4,0,1,0,0,0,0,0,2,0,0,0,1,0,0,0,0,0,0,0,0,0,0,0,0,0,1],
            "Year" : [1948,1948,1949,1950,1950,1951,1951,1951,1951,1951,1951,1952,1952,1952,1953,1954,1954,1956,1957,1957,1957,1959,1959,1960,1961,1961,1963,1964,1964,1966,1967,1967,1970,1976,1979,1981,1987,1988,1988,1989,1993]
         },
         "y" : {
            "data" : [
              [1,2,1,1,2,1,2,3,4,5,6,1,2,3,1,1,2,1,1,2,3,1,2,1,1,2,1,1,2,1,1,2,1,1,1,1,1,1,2,1,1]
            ],
            "smps" : ["Dutch in Seven Lessons","High Button Shoes","Sauce Tartare","Saturday Night Revue","Sauce Piquante","One Wild Oat","Young Wives' Tale","Laughter in Paradise","The Lavender Hill Mob","Sunday Night Theatre","Gigi","Secret People","Monte Carlo Baby","CBS Television Workshop","Roman Holiday","Sabrina","Ondine","War and Peace","Love in the Afternoon","Funny Face","Producers' Showcase","Green Mansions","The Nun's Story","The Unforgiven","Breakfast at Tiffany's","The Children's Hour","Charade","Paris When It Sizzles","My Fair Lady","How to Steal a Million","Two for the Road","Wait Until Dark","A World of Love","Robin and Marian","Bloodline","They All Laughed","Love Among Thieves","American Masters","Gregory Peck :  His Own Man","Always","Gardens of the World with Audrey Hepburn"],
            "vars" : ["Number"]
         }
      }

      // Create the configuration for the graph
      var config = {
         "backgroundImage" : "https://www.canvasxpress.org/assets/images/Audrey.jpg",
         "backgroundType" : "image",
         "colorBy" : "Type",
         "colorScheme" : "Greens",
         "graphOrientation" : "vertical",
         "graphType" : "Dotplot",
         "groupingFactors" : ["Year"],
         "isGraphTime" : true,
         "jitter" : false,
         "legendColumns" : 3,
         "legendKeyBackgroundBorderColor" : "rgba(255,255,255,0)",
         "legendKeyBackgroundColor" : "rgba(255,255,255,0)",
         "legendPosition" : "top",
         "legendTextScaleFontFactor" : 2,
         "legendTitleScaleFontFactor" : 2,
         "marginLeft" : 150,
         "marginRight" : 150,
         "objectBorderColor" : "rgba(0,0,0)",
         "showErrorBars" : false,
         "showLegendTitle" : false,
         "smpLabelInterval" : 1,
         "smpTextRotate" : 90,
         "timeFormat" : "year",
         "title" : "The Life and Films of Audrey Hepburn",
         "xAxis" : ["Number"],
         "xAxis2Show" : false,
         "xAxisGridMajorShow" : false,
         "xAxisGridMinorShow" : false,
         "xAxisShow" : false
      }

      // Event used to create graph (optional)
      var events = {
        "mousemove": function (o, e, t) {
          if (o && o.objectType && o.objectType == 'Property') {
            t.showInfoSpan(e, o.display);
          } else if (o && o.y && o.objectType != 'Smp') {
            var str = "<b>" + o.y.smps + "</b><br><b>Year: </b>" + o.y.Year + "<br><b>Type: </b>" + o.y.Type;
            t.showInfoSpan(e, str);
          }
        }
      }

            // Call the CanvasXpress function to create the graph
      var cX = new CanvasXpress("canvasId", data, config, events);

    </script>

  </body>

</html>
library(canvasXpress)
y=read.table("https://www.canvasxpress.org/data/r/cX-audrey-dat.txt", header=TRUE, sep="\t", quote="", row.names=1, fill=TRUE, check.names=FALSE, stringsAsFactors=FALSE)
x=read.table("https://www.canvasxpress.org/data/r/cX-audrey-smp.txt", header=TRUE, sep="\t", quote="", row.names=1, fill=TRUE, check.names=FALSE, stringsAsFactors=FALSE)
canvasXpress(
data=y,
smpAnnot=x,
backgroundImage="https://www.canvasxpress.org/assets/images/Audrey.jpg",
backgroundType="image",
colorBy="Type",
colorScheme="Greens",
graphOrientation="vertical",
graphType="Dotplot",
groupingFactors=list("Year"),
isGraphTime=TRUE,
jitter=FALSE,
legendColumns=3,
legendKeyBackgroundBorderColor="rgba(255,255,255,0)",
legendKeyBackgroundColor="rgba(255,255,255,0)",
legendPosition="top",
legendTextScaleFontFactor=2,
legendTitleScaleFontFactor=2,
marginLeft=150,
marginRight=150,
objectBorderColor="rgba(0,0,0)",
showErrorBars=FALSE,
showLegendTitle=FALSE,
smpLabelInterval=1,
smpTextRotate=90,
timeFormat="year",
title="The Life and Films of Audrey Hepburn",
xAxis=list("Number"),
xAxis2Show=FALSE,
xAxisGridMajorShow=FALSE,
xAxisGridMinorShow=FALSE,
xAxisShow=FALSE
)
from canvasxpress.canvas import CanvasXpress
from canvasxpress.plot import show_in_browser
from canvasxpress.js.function import CXEvent
from canvasxpress.js.collection import CXEvents

if __name__ == "__main__":
  # Define the chart with its data and configuration
  chart: CanvasXpress = CanvasXpress(
    render_to = "dotplot13",
    data = {
      "x": {
        "Recognitions": [0, 0, 0, 0, 0, 0, 0, 0, 0, 0, 0, 0, 0, 0, 4, 3, 1, 2, 2, 0, 0, 0, 4, 0, 2, 0, 2, 0, 2, 0, 1, 3, 0, 0, 0, 0, 0, 0, 0, 0, 1],
        "Recognized": ["No", "No", "No", "No", "No", "No", "No", "No", "No", "No", "No", "No", "No", "No", "Yes", "Yes", "Yes", "Yes", "Yes", "No", "No", "No", "Yes", "No", "Yes", "No", "Yes", "No", "Yes", "No", "Yes", "Yes", "No", "No", "No", "No", "No", "No", "No", "No", "Yes"],
        "Type": ["Film", "Stage", "Stage", "Television", "Stage", "Film", "Film", "Film", "Film", "Television", "Stage", "Film", "Film", "Television", "Film", "Film", "Stage", "Film", "Film", "Film", "Television", "Film", "Film", "Film", "Film", "Film", "Film", "Film", "Film", "Film", "Film", "Film", "Television", "Film", "Film", "Film", "Television", "Television", "Television", "Film", "Television"],
        "Winnings": [0, 0, 0, 0, 0, 0, 0, 0, 0, 0, 0, 0, 0, 0, 4, 0, 1, 0, 0, 0, 0, 0, 2, 0, 0, 0, 1, 0, 0, 0, 0, 0, 0, 0, 0, 0, 0, 0, 0, 0, 1],
        "Year": [1948, 1948, 1949, 1950, 1950, 1951, 1951, 1951, 1951, 1951, 1951, 1952, 1952, 1952, 1953, 1954, 1954, 1956, 1957, 1957, 1957, 1959, 1959, 1960, 1961, 1961, 1963, 1964, 1964, 1966, 1967, 1967, 1970, 1976, 1979, 1981, 1987, 1988, 1988, 1989, 1993]
      },
      "y": {
        "data": [
          [1, 2, 1, 1, 2, 1, 2, 3, 4, 5, 6, 1, 2, 3, 1, 1, 2, 1, 1, 2, 3, 1, 2, 1, 1, 2, 1, 1, 2, 1, 1, 2, 1, 1, 1, 1, 1, 1, 2, 1, 1]
        ],
        "smps": ["Dutch in Seven Lessons", "High Button Shoes", "Sauce Tartare", "Saturday Night Revue", "Sauce Piquante", "One Wild Oat", "Young Wives' Tale", "Laughter in Paradise", "The Lavender Hill Mob", "Sunday Night Theatre", "Gigi", "Secret People", "Monte Carlo Baby", "CBS Television Workshop", "Roman Holiday", "Sabrina", "Ondine", "War and Peace", "Love in the Afternoon", "Funny Face", "Producers' Showcase", "Green Mansions", "The Nun's Story", "The Unforgiven", "Breakfast at Tiffany's", "The Children's Hour", "Charade", "Paris When It Sizzles", "My Fair Lady", "How to Steal a Million", "Two for the Road", "Wait Until Dark", "A World of Love", "Robin and Marian", "Bloodline", "They All Laughed", "Love Among Thieves", "American Masters", "Gregory Peck :  His Own Man", "Always", "Gardens of the World with Audrey Hepburn"],
        "vars": ["Number"]
      }
    },
    config = {
      "backgroundImage": "https://www.canvasxpress.org/assets/images/Audrey.jpg",
      "backgroundType": "image",
      "colorBy": "Type",
      "colorScheme": "Greens",
      "graphOrientation": "vertical",
      "graphType": "Dotplot",
      "groupingFactors": ["Year"],
      "isGraphTime": True,
      "jitter": False,
      "legendColumns": 3,
      "legendKeyBackgroundBorderColor": "rgba(255,255,255,0)",
      "legendKeyBackgroundColor": "rgba(255,255,255,0)",
      "legendPosition": "top",
      "legendTextScaleFontFactor": 2,
      "legendTitleScaleFontFactor": 2,
      "marginLeft": 150,
      "marginRight": 150,
      "objectBorderColor": "rgba(0,0,0)",
      "showErrorBars": False,
      "showLegendTitle": False,
      "smpLabelInterval": 1,
      "smpTextRotate": 90,
      "timeFormat": "year",
      "title": "The Life and Films of Audrey Hepburn",
      "xAxis": ["Number"],
      "xAxis2Show": False,
      "xAxisGridMajorShow": False,
      "xAxisGridMinorShow": False,
      "xAxisShow": False
    },
    events = CXEvents(
      CXEvent(
        id = "mousemove",
        script = """
        if (o && o.objectType && o.objectType == 'Property') {
          t.showInfoSpan(e, o.display);
        } else if (o && o.y && o.objectType != 'Smp') {
          var str = "<b>" + o.y.smps + "</b><br><b>Year: </b>" + o.y.Year + "<br><b>Type: </b>" + o.y.Type;
          t.showInfoSpan(e, str);
        }
        """
      )
    ),
    width = 600,
    height = 350
  )

  # Display the chart in its own Web page
  show_in_browser(chart)
Run this notebook:

from canvasxpress.canvas import CanvasXpress
from canvasxpress.plot import graph
from canvasxpress.js.function import CXEvent
from canvasxpress.js.collection import CXEvents

graph(
  CanvasXpress(
    render_to = "dotplot13",
    data = {
      "x": {
        "Recognitions": [0, 0, 0, 0, 0, 0, 0, 0, 0, 0, 0, 0, 0, 0, 4, 3, 1, 2, 2, 0, 0, 0, 4, 0, 2, 0, 2, 0, 2, 0, 1, 3, 0, 0, 0, 0, 0, 0, 0, 0, 1],
        "Recognized": ["No", "No", "No", "No", "No", "No", "No", "No", "No", "No", "No", "No", "No", "No", "Yes", "Yes", "Yes", "Yes", "Yes", "No", "No", "No", "Yes", "No", "Yes", "No", "Yes", "No", "Yes", "No", "Yes", "Yes", "No", "No", "No", "No", "No", "No", "No", "No", "Yes"],
        "Type": ["Film", "Stage", "Stage", "Television", "Stage", "Film", "Film", "Film", "Film", "Television", "Stage", "Film", "Film", "Television", "Film", "Film", "Stage", "Film", "Film", "Film", "Television", "Film", "Film", "Film", "Film", "Film", "Film", "Film", "Film", "Film", "Film", "Film", "Television", "Film", "Film", "Film", "Television", "Television", "Television", "Film", "Television"],
        "Winnings": [0, 0, 0, 0, 0, 0, 0, 0, 0, 0, 0, 0, 0, 0, 4, 0, 1, 0, 0, 0, 0, 0, 2, 0, 0, 0, 1, 0, 0, 0, 0, 0, 0, 0, 0, 0, 0, 0, 0, 0, 1],
        "Year": [1948, 1948, 1949, 1950, 1950, 1951, 1951, 1951, 1951, 1951, 1951, 1952, 1952, 1952, 1953, 1954, 1954, 1956, 1957, 1957, 1957, 1959, 1959, 1960, 1961, 1961, 1963, 1964, 1964, 1966, 1967, 1967, 1970, 1976, 1979, 1981, 1987, 1988, 1988, 1989, 1993]
      },
      "y": {
        "data": [
          [1, 2, 1, 1, 2, 1, 2, 3, 4, 5, 6, 1, 2, 3, 1, 1, 2, 1, 1, 2, 3, 1, 2, 1, 1, 2, 1, 1, 2, 1, 1, 2, 1, 1, 1, 1, 1, 1, 2, 1, 1]
        ],
        "smps": ["Dutch in Seven Lessons", "High Button Shoes", "Sauce Tartare", "Saturday Night Revue", "Sauce Piquante", "One Wild Oat", "Young Wives' Tale", "Laughter in Paradise", "The Lavender Hill Mob", "Sunday Night Theatre", "Gigi", "Secret People", "Monte Carlo Baby", "CBS Television Workshop", "Roman Holiday", "Sabrina", "Ondine", "War and Peace", "Love in the Afternoon", "Funny Face", "Producers' Showcase", "Green Mansions", "The Nun's Story", "The Unforgiven", "Breakfast at Tiffany's", "The Children's Hour", "Charade", "Paris When It Sizzles", "My Fair Lady", "How to Steal a Million", "Two for the Road", "Wait Until Dark", "A World of Love", "Robin and Marian", "Bloodline", "They All Laughed", "Love Among Thieves", "American Masters", "Gregory Peck :  His Own Man", "Always", "Gardens of the World with Audrey Hepburn"],
        "vars": ["Number"]
      }
    },
    config = {
      "backgroundImage": "https://www.canvasxpress.org/assets/images/Audrey.jpg",
      "backgroundType": "image",
      "colorBy": "Type",
      "colorScheme": "Greens",
      "graphOrientation": "vertical",
      "graphType": "Dotplot",
      "groupingFactors": ["Year"],
      "isGraphTime": True,
      "jitter": False,
      "legendColumns": 3,
      "legendKeyBackgroundBorderColor": "rgba(255,255,255,0)",
      "legendKeyBackgroundColor": "rgba(255,255,255,0)",
      "legendPosition": "top",
      "legendTextScaleFontFactor": 2,
      "legendTitleScaleFontFactor": 2,
      "marginLeft": 150,
      "marginRight": 150,
      "objectBorderColor": "rgba(0,0,0)",
      "showErrorBars": False,
      "showLegendTitle": False,
      "smpLabelInterval": 1,
      "smpTextRotate": 90,
      "timeFormat": "year",
      "title": "The Life and Films of Audrey Hepburn",
      "xAxis": ["Number"],
      "xAxis2Show": False,
      "xAxisGridMajorShow": False,
      "xAxisGridMinorShow": False,
      "xAxisShow": False
    },
    events = CXEvents(
      CXEvent(
        id = "mousemove",
        script = """
        if (o && o.objectType && o.objectType == 'Property') {
          t.showInfoSpan(e, o.display);
        } else if (o && o.y && o.objectType != 'Smp') {
          var str = "<b>" + o.y.smps + "</b><br><b>Year: </b>" + o.y.Year + "<br><b>Type: </b>" + o.y.Type;
          t.showInfoSpan(e, str);
        }
        """
      )
    ),
    width = 600,
    height = 350
  )
)