Pheatmap Visualization for Synthetic Data
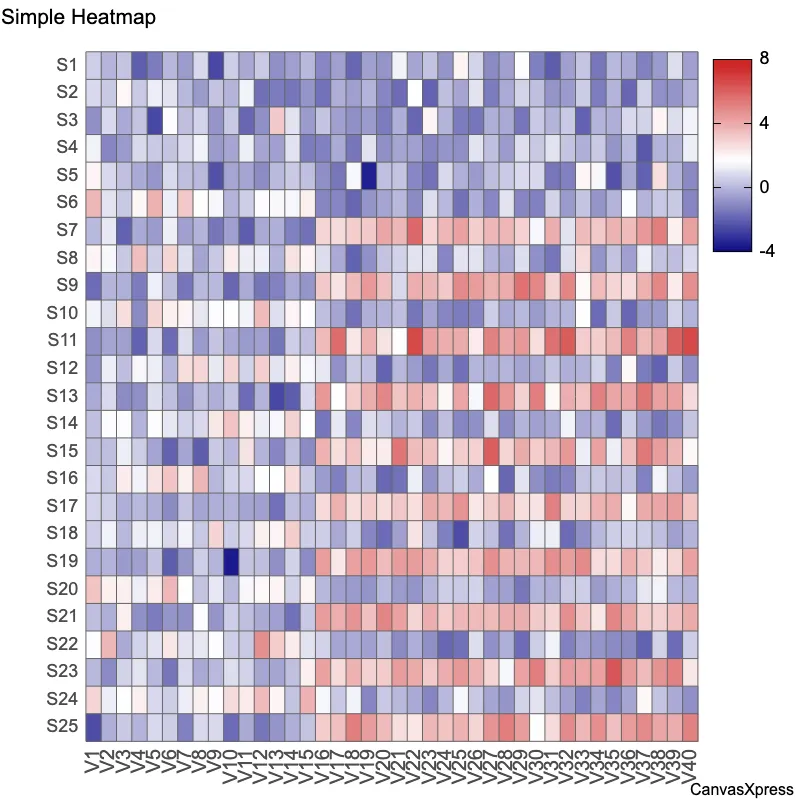
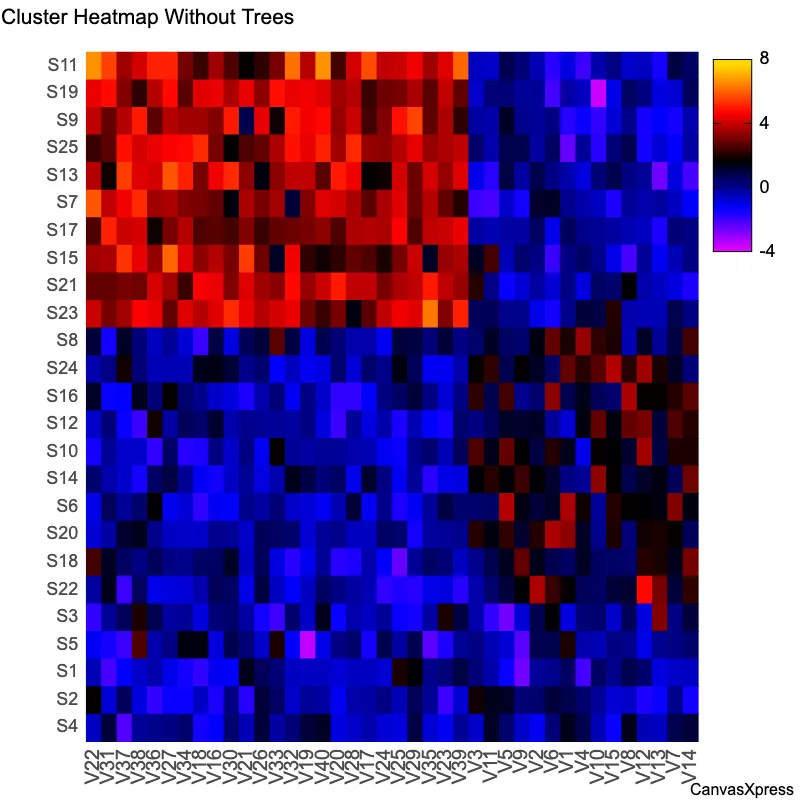
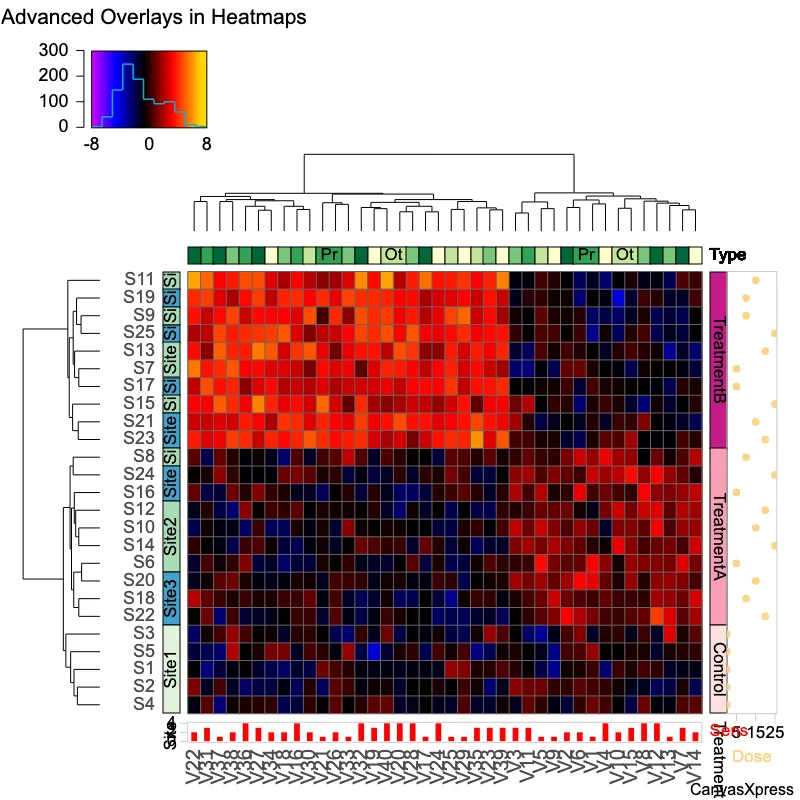
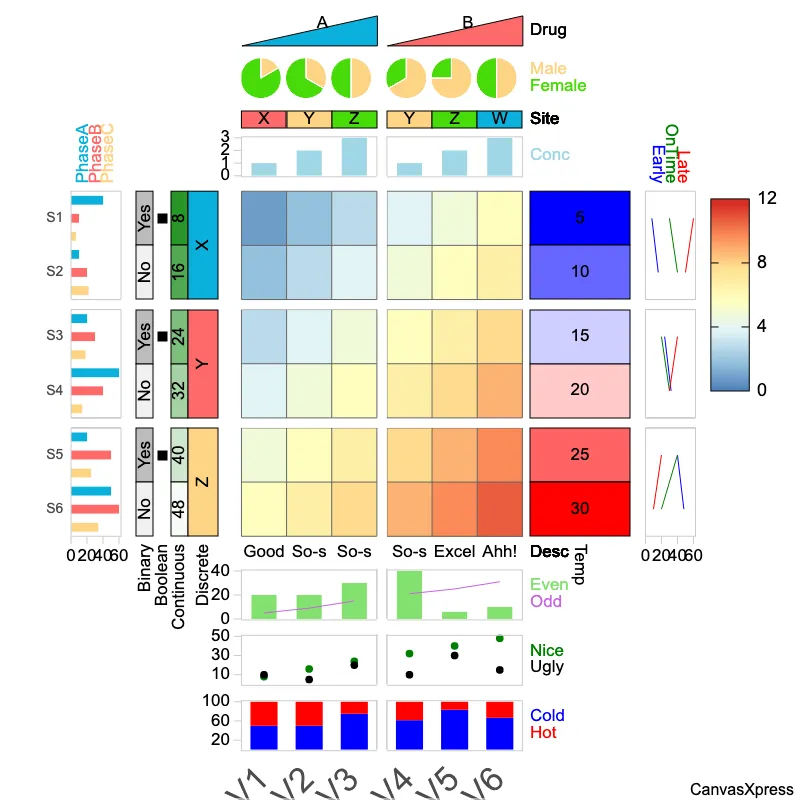
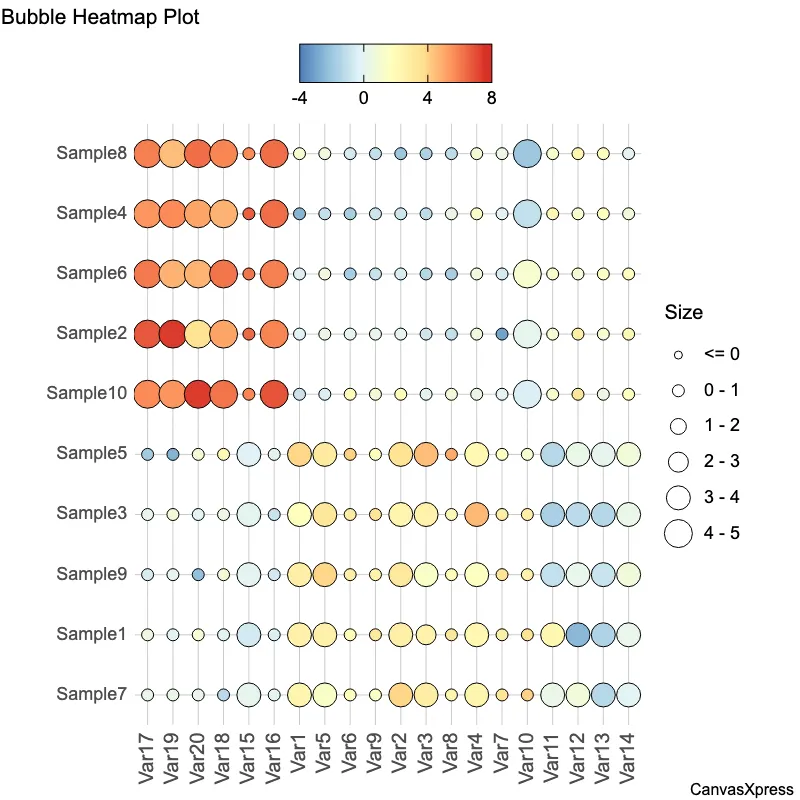
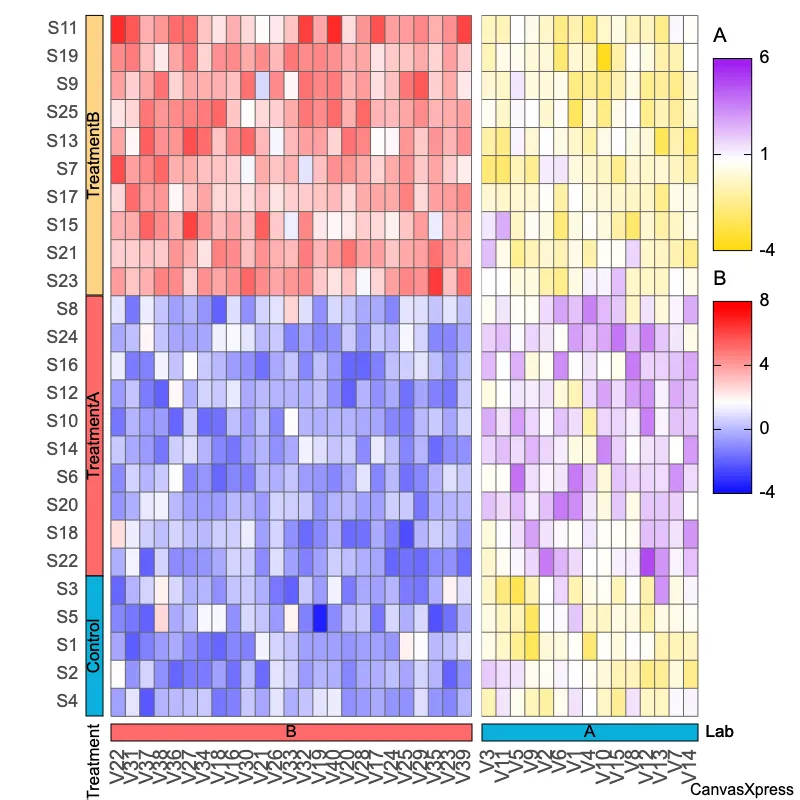
Heatmap graphs provide a visual representation of data using color variations to represent different values. They are incredibly useful for identifying patterns, trends, and outliers in datasets. Commonly used in various fields, from geographical analysis to website usability studies, heatmaps offer an intuitive way to understand complex data. Creating effective heatmaps involves selecting the appropriate color scheme and scaling to highlight meaningful differences. Interactive heatmaps further enhance analysis by allowing users to zoom, pan, and explore data points in detail. This makes them powerful tools for data-driven decision making across numerous disciplines.


<html>

  <head>
    <!-- Include the CanvasXpress library in your HTML file -->
    <link rel="stylesheet" href="https://www.canvasxpress.org/dist/canvasXpress.css" type="text/css"/>
    <script src="https://www.canvasxpress.org/dist/canvasXpress.min.js"></script>
  </head>

  <body>

    <!-- Create a canvas element for the chart with the desired dimensions -->
    <div>
      <canvas id="canvasId" width="600" height="600"></canvas>
    </div>


    <!-- Create a script to initialize the chart -->
    <script>

      // Create the data for the graph
      var data = {
         "x" : {
            "CellType" : ["CT1","CT2","CT1","CT2","CT1","CT2","CT1","CT2","CT1","CT2"],
            "Dose" : [40,40,20,20,15,30,50,15,30,50],
            "Drug" : ["A","B","A","B","A","B","A","B","A","B"],
            "Time" : ["t1","t2","t3","t4","t5","t1","t2","t3","t4","t5"]
         },
         "y" : {
            "data" : [
              [2.82,-0.06,1.94,-2.35,4.19,-0.13,2.55,1.49,3.02,-0.7],
              [3.001,0.3289,2.55,-0.552,3.766,-0.28,4.153,-1.759,3.363,2.09],
              [2.82,-0.53,2.87,-0.89,4.84,-1.12,3.11,-1.26,1.58,0.19],
              [2.5,0.86,4.89,1.7,2.54,0.95,2.65,1.22,1.82,0.64],
              [2.81,0.64,3.47,-0.74,3.17,0.85,1.66,0.89,4.18,-0.17],
              [2.23,0.18,3.27,-1.53,4.3,-1.49,2.16,-0.48,2.93,2.26],
              [2.98,-2.8,3.1,-0.03,1.89,-0.48,3.53,0.68,3.71,0.04],
              [3.49,-0.79,2.36,0.62,5.25,-1.51,2.65,-0.99,2.21,1.18],
              [3.35,0.47,3.58,-0.5,2.15,-0.7,1.74,-0.82,2.76,1.1],
              [3.72,0.27,2.91,-0.82,1.42,1.44,4.32,-1.72,2.8,-0.15],
              [2.53,1.33,-1.41,2.36,-1.2,1.48,0.56,1.48,-0.81,1.39],
              [-2.23,3.04,-1.05,1.43,0.53,1.14,1.09,2.57,0.37,3.53],
              [-1.3,1.48,-1.1,1.99,0.25,1.91,-1.11,1.99,-0.62,0.76],
              [0.4,2.37,0.49,1.07,1.03,2.06,0.11,0.1,1.08,2.02],
              [-0.42,6.68,0.19,6.96,-0.01,6.49,0.33,5.97,0.24,6.17],
              [-0.24,6.11,-0.69,6.6,0.2,6.23,0.13,6.6,-0.48,7.22],
              [0.8,7.04,0.46,5.7,-1.68,6.41,0.48,6.2,-0.36,6.04],
              [0.02,5.44,0.65,5.03,2.4,6.52,-1.02,6.13,1.16,6.5],
              [0.01,7.7,1.17,5.98,-2.31,5.01,0.6,4.81,0.25,5.74],
              [1.28,3.76,0.08,5.34,1.1,5,0.46,6.59,-1.98,7.75]
            ],
            "smps" : ["Sample1","Sample2","Sample3","Sample4","Sample5","Sample6","Sample7","Sample8","Sample9","Sample10"],
            "vars" : ["Var1","Var2","Var3","Var4","Var5","Var6","Var7","Var8","Var9","Var10","Var11","Var12","Var13","Var14","Var15","Var16","Var17","Var18","Var19","Var20"]
         },
         "z" : {
            "GeneClass" : ["Path1","Path1","Path1","Path1","Path1","Path1","Path1","Path1","Path1","Path1","Path2","Path2","Path2","Path2","Path3","Path3","Path3","Path3","Path3","Path3"],
            "ProteinA" : [2.82,0.32,4.89,3.27,5.7,6.41,0.48,1.98,7.04,4.18,2.31,3.52,1.72,6.51,5.44,1.28,0.46,4.32,1.39,7.77]
         }
      }

      // Create the configuration for the graph
      var config = {
         "graphType" : "Heatmap",
         "heatmapIndicatorPosition" : "right",
         "overlayFontStyle" : "bold",
         "overlayScaleFontFactor" : 2,
         "samplesClustered" : true,
         "showSmpOverlaysLegend" : true,
         "showValueOverlays" : false,
         "showVarOverlaysLegend" : true,
         "smpDendrogramPosition" : "right",
         "smpOverlayProperties" : {
            "CellType" : {
               "position" : "right",
               "scheme" : "Matlab",
               "showLegend" : true,
               "type" : "Default"
            },
            "Dose" : {
               "color" : "blue",
               "position" : "left",
               "thickness" : 80,
               "type" : "Bar"
            },
            "Drug" : {
               "position" : "left",
               "scheme" : "Lancet",
               "showLegend" : true,
               "thickness" : 30,
               "type" : "Increase"
            },
            "Time" : {
               "position" : "right",
               "scheme" : "Greens",
               "showLegend" : true,
               "type" : "Default"
            }
         },
         "smpOverlays" : ["Drug","-","Dose","CellType","-","Time"],
         "smpTitleLabelPosition" : "right",
         "varOverlayProperties" : {
            "GeneClass" : {
               "position" : "top",
               "scheme" : "GGPlot",
               "showLegend" : true,
               "thickness" : 20,
               "type" : "Default"
            },
            "ProteinA" : {
               "color" : "green",
               "position" : "top",
               "thickness" : 45,
               "type" : "Line"
            }
         },
         "varOverlays" : ["ProteinA","-","GeneClass"],
         "varTitleLabelPosition" : "bottom",
         "variablesClustered" : true,
         "xAxis" : ["Var1","Var2","Var3","Var4","Var5","Var6","Var7","Var8","Var9","Var10","Var11","Var12","Var13","Var14","Var15","Var16","Var17","Var18","Var19","Var20"]
      }

      // Event used to create graph (optional)
      var events = false

            // Call the CanvasXpress function to create the graph
      var cX = new CanvasXpress("canvasId", data, config, events);

    </script>

  </body>

</html>
library(canvasXpress)
y=read.table("https://www.canvasxpress.org/data/r/cX-pheatmap-dat.txt", header=TRUE, sep="\t", quote="", row.names=1, fill=TRUE, check.names=FALSE, stringsAsFactors=FALSE)
x=read.table("https://www.canvasxpress.org/data/r/cX-pheatmap-smp.txt", header=TRUE, sep="\t", quote="", row.names=1, fill=TRUE, check.names=FALSE, stringsAsFactors=FALSE)
z=read.table("https://www.canvasxpress.org/data/r/cX-pheatmap-var.txt", header=TRUE, sep="\t", quote="", row.names=1, fill=TRUE, check.names=FALSE, stringsAsFactors=FALSE)
canvasXpress(
data=y,
smpAnnot=x,
varAnnot=z,
graphType="Heatmap",
heatmapIndicatorPosition="right",
overlayFontStyle="bold",
overlayScaleFontFactor=2,
samplesClustered=TRUE,
showSmpOverlaysLegend=TRUE,
showValueOverlays=FALSE,
showVarOverlaysLegend=TRUE,
smpDendrogramPosition="right",
smpOverlayProperties=list(CellType=list(position="right", scheme="Matlab", showLegend="True", type="Default"), Dose=list(color="blue", position="left", thickness=80, type="Bar"), Drug=list(position="left", scheme="Lancet", showLegend="True", thickness=30, type="Increase"), Time=list(position="right", scheme="Greens", showLegend="True", type="Default")),
smpOverlays=list("Drug", "-", "Dose", "CellType", "-", "Time"),
smpTitleLabelPosition="right",
varOverlayProperties=list(GeneClass=list(position="top", scheme="GGPlot", showLegend="True", thickness=20, type="Default"), ProteinA=list(color="green", position="top", thickness=45, type="Line")),
varOverlays=list("ProteinA", "-", "GeneClass"),
varTitleLabelPosition="bottom",
variablesClustered=TRUE,
xAxis=list("Var1", "Var2", "Var3", "Var4", "Var5", "Var6", "Var7", "Var8", "Var9", "Var10", "Var11", "Var12", "Var13", "Var14", "Var15", "Var16", "Var17", "Var18", "Var19", "Var20")
)
from canvasxpress.canvas import CanvasXpress
from canvasxpress.plot import show_in_browser

if __name__ == "__main__":
  # Define the chart with its data and configuration
  chart: CanvasXpress = CanvasXpress(
    render_to = "heatmap13",
    data = {
      "x": {
        "CellType": ["CT1", "CT2", "CT1", "CT2", "CT1", "CT2", "CT1", "CT2", "CT1", "CT2"],
        "Dose": [40, 40, 20, 20, 15, 30, 50, 15, 30, 50],
        "Drug": ["A", "B", "A", "B", "A", "B", "A", "B", "A", "B"],
        "Time": ["t1", "t2", "t3", "t4", "t5", "t1", "t2", "t3", "t4", "t5"]
      },
      "y": {
        "data": [
          [2.82, -0.06, 1.94, -2.35, 4.19, -0.13, 2.55, 1.49, 3.02, -0.7],
          [3.001, 0.3289, 2.55, -0.552, 3.766, -0.28, 4.153, -1.759, 3.363, 2.09],
          [2.82, -0.53, 2.87, -0.89, 4.84, -1.12, 3.11, -1.26, 1.58, 0.19],
          [2.5, 0.86, 4.89, 1.7, 2.54, 0.95, 2.65, 1.22, 1.82, 0.64],
          [2.81, 0.64, 3.47, -0.74, 3.17, 0.85, 1.66, 0.89, 4.18, -0.17],
          [2.23, 0.18, 3.27, -1.53, 4.3, -1.49, 2.16, -0.48, 2.93, 2.26],
          [2.98, -2.8, 3.1, -0.03, 1.89, -0.48, 3.53, 0.68, 3.71, 0.04],
          [3.49, -0.79, 2.36, 0.62, 5.25, -1.51, 2.65, -0.99, 2.21, 1.18],
          [3.35, 0.47, 3.58, -0.5, 2.15, -0.7, 1.74, -0.82, 2.76, 1.1],
          [3.72, 0.27, 2.91, -0.82, 1.42, 1.44, 4.32, -1.72, 2.8, -0.15],
          [2.53, 1.33, -1.41, 2.36, -1.2, 1.48, 0.56, 1.48, -0.81, 1.39],
          [-2.23, 3.04, -1.05, 1.43, 0.53, 1.14, 1.09, 2.57, 0.37, 3.53],
          [-1.3, 1.48, -1.1, 1.99, 0.25, 1.91, -1.11, 1.99, -0.62, 0.76],
          [0.4, 2.37, 0.49, 1.07, 1.03, 2.06, 0.11, 0.1, 1.08, 2.02],
          [-0.42, 6.68, 0.19, 6.96, -0.01, 6.49, 0.33, 5.97, 0.24, 6.17],
          [-0.24, 6.11, -0.69, 6.6, 0.2, 6.23, 0.13, 6.6, -0.48, 7.22],
          [0.8, 7.04, 0.46, 5.7, -1.68, 6.41, 0.48, 6.2, -0.36, 6.04],
          [0.02, 5.44, 0.65, 5.03, 2.4, 6.52, -1.02, 6.13, 1.16, 6.5],
          [0.01, 7.7, 1.17, 5.98, -2.31, 5.01, 0.6, 4.81, 0.25, 5.74],
          [1.28, 3.76, 0.08, 5.34, 1.1, 5, 0.46, 6.59, -1.98, 7.75]
        ],
        "smps": ["Sample1", "Sample2", "Sample3", "Sample4", "Sample5", "Sample6", "Sample7", "Sample8", "Sample9", "Sample10"],
        "vars": ["Var1", "Var2", "Var3", "Var4", "Var5", "Var6", "Var7", "Var8", "Var9", "Var10", "Var11", "Var12", "Var13", "Var14", "Var15", "Var16", "Var17", "Var18", "Var19", "Var20"]
      },
      "z": {
        "GeneClass": ["Path1", "Path1", "Path1", "Path1", "Path1", "Path1", "Path1", "Path1", "Path1", "Path1", "Path2", "Path2", "Path2", "Path2", "Path3", "Path3", "Path3", "Path3", "Path3", "Path3"],
        "ProteinA": [2.82, 0.32, 4.89, 3.27, 5.7, 6.41, 0.48, 1.98, 7.04, 4.18, 2.31, 3.52, 1.72, 6.51, 5.44, 1.28, 0.46, 4.32, 1.39, 7.77]
      }
    },
    config = {
      "graphType": "Heatmap",
      "heatmapIndicatorPosition": "right",
      "overlayFontStyle": "bold",
      "overlayScaleFontFactor": 2,
      "samplesClustered": True,
      "showSmpOverlaysLegend": True,
      "showValueOverlays": False,
      "showVarOverlaysLegend": True,
      "smpDendrogramPosition": "right",
      "smpOverlayProperties": {
        "CellType": {
          "position": "right",
          "scheme": "Matlab",
          "showLegend": True,
          "type": "Default"
        },
        "Dose": {
          "color": "blue",
          "position": "left",
          "thickness": 80,
          "type": "Bar"
        },
        "Drug": {
          "position": "left",
          "scheme": "Lancet",
          "showLegend": True,
          "thickness": 30,
          "type": "Increase"
        },
        "Time": {
          "position": "right",
          "scheme": "Greens",
          "showLegend": True,
          "type": "Default"
        }
      },
      "smpOverlays": ["Drug", "-", "Dose", "CellType", "-", "Time"],
      "smpTitleLabelPosition": "right",
      "varOverlayProperties": {
        "GeneClass": {
          "position": "top",
          "scheme": "GGPlot",
          "showLegend": True,
          "thickness": 20,
          "type": "Default"
        },
        "ProteinA": {
          "color": "green",
          "position": "top",
          "thickness": 45,
          "type": "Line"
        }
      },
      "varOverlays": ["ProteinA", "-", "GeneClass"],
      "varTitleLabelPosition": "bottom",
      "variablesClustered": True,
      "xAxis": ["Var1", "Var2", "Var3", "Var4", "Var5", "Var6", "Var7", "Var8", "Var9", "Var10", "Var11", "Var12", "Var13", "Var14", "Var15", "Var16", "Var17", "Var18", "Var19", "Var20"]
    },
    width = 600,
    height = 400
  )

  # Display the chart in its own Web page
  show_in_browser(chart)
Run this notebook:

from canvasxpress.canvas import CanvasXpress
from canvasxpress.plot import graph

graph(
  CanvasXpress(
    render_to = "heatmap13",
    data = {
      "x": {
        "CellType": ["CT1", "CT2", "CT1", "CT2", "CT1", "CT2", "CT1", "CT2", "CT1", "CT2"],
        "Dose": [40, 40, 20, 20, 15, 30, 50, 15, 30, 50],
        "Drug": ["A", "B", "A", "B", "A", "B", "A", "B", "A", "B"],
        "Time": ["t1", "t2", "t3", "t4", "t5", "t1", "t2", "t3", "t4", "t5"]
      },
      "y": {
        "data": [
          [2.82, -0.06, 1.94, -2.35, 4.19, -0.13, 2.55, 1.49, 3.02, -0.7],
          [3.001, 0.3289, 2.55, -0.552, 3.766, -0.28, 4.153, -1.759, 3.363, 2.09],
          [2.82, -0.53, 2.87, -0.89, 4.84, -1.12, 3.11, -1.26, 1.58, 0.19],
          [2.5, 0.86, 4.89, 1.7, 2.54, 0.95, 2.65, 1.22, 1.82, 0.64],
          [2.81, 0.64, 3.47, -0.74, 3.17, 0.85, 1.66, 0.89, 4.18, -0.17],
          [2.23, 0.18, 3.27, -1.53, 4.3, -1.49, 2.16, -0.48, 2.93, 2.26],
          [2.98, -2.8, 3.1, -0.03, 1.89, -0.48, 3.53, 0.68, 3.71, 0.04],
          [3.49, -0.79, 2.36, 0.62, 5.25, -1.51, 2.65, -0.99, 2.21, 1.18],
          [3.35, 0.47, 3.58, -0.5, 2.15, -0.7, 1.74, -0.82, 2.76, 1.1],
          [3.72, 0.27, 2.91, -0.82, 1.42, 1.44, 4.32, -1.72, 2.8, -0.15],
          [2.53, 1.33, -1.41, 2.36, -1.2, 1.48, 0.56, 1.48, -0.81, 1.39],
          [-2.23, 3.04, -1.05, 1.43, 0.53, 1.14, 1.09, 2.57, 0.37, 3.53],
          [-1.3, 1.48, -1.1, 1.99, 0.25, 1.91, -1.11, 1.99, -0.62, 0.76],
          [0.4, 2.37, 0.49, 1.07, 1.03, 2.06, 0.11, 0.1, 1.08, 2.02],
          [-0.42, 6.68, 0.19, 6.96, -0.01, 6.49, 0.33, 5.97, 0.24, 6.17],
          [-0.24, 6.11, -0.69, 6.6, 0.2, 6.23, 0.13, 6.6, -0.48, 7.22],
          [0.8, 7.04, 0.46, 5.7, -1.68, 6.41, 0.48, 6.2, -0.36, 6.04],
          [0.02, 5.44, 0.65, 5.03, 2.4, 6.52, -1.02, 6.13, 1.16, 6.5],
          [0.01, 7.7, 1.17, 5.98, -2.31, 5.01, 0.6, 4.81, 0.25, 5.74],
          [1.28, 3.76, 0.08, 5.34, 1.1, 5, 0.46, 6.59, -1.98, 7.75]
        ],
        "smps": ["Sample1", "Sample2", "Sample3", "Sample4", "Sample5", "Sample6", "Sample7", "Sample8", "Sample9", "Sample10"],
        "vars": ["Var1", "Var2", "Var3", "Var4", "Var5", "Var6", "Var7", "Var8", "Var9", "Var10", "Var11", "Var12", "Var13", "Var14", "Var15", "Var16", "Var17", "Var18", "Var19", "Var20"]
      },
      "z": {
        "GeneClass": ["Path1", "Path1", "Path1", "Path1", "Path1", "Path1", "Path1", "Path1", "Path1", "Path1", "Path2", "Path2", "Path2", "Path2", "Path3", "Path3", "Path3", "Path3", "Path3", "Path3"],
        "ProteinA": [2.82, 0.32, 4.89, 3.27, 5.7, 6.41, 0.48, 1.98, 7.04, 4.18, 2.31, 3.52, 1.72, 6.51, 5.44, 1.28, 0.46, 4.32, 1.39, 7.77]
      }
    },
    config = {
      "graphType": "Heatmap",
      "heatmapIndicatorPosition": "right",
      "overlayFontStyle": "bold",
      "overlayScaleFontFactor": 2,
      "samplesClustered": True,
      "showSmpOverlaysLegend": True,
      "showValueOverlays": False,
      "showVarOverlaysLegend": True,
      "smpDendrogramPosition": "right",
      "smpOverlayProperties": {
        "CellType": {
          "position": "right",
          "scheme": "Matlab",
          "showLegend": True,
          "type": "Default"
        },
        "Dose": {
          "color": "blue",
          "position": "left",
          "thickness": 80,
          "type": "Bar"
        },
        "Drug": {
          "position": "left",
          "scheme": "Lancet",
          "showLegend": True,
          "thickness": 30,
          "type": "Increase"
        },
        "Time": {
          "position": "right",
          "scheme": "Greens",
          "showLegend": True,
          "type": "Default"
        }
      },
      "smpOverlays": ["Drug", "-", "Dose", "CellType", "-", "Time"],
      "smpTitleLabelPosition": "right",
      "varOverlayProperties": {
        "GeneClass": {
          "position": "top",
          "scheme": "GGPlot",
          "showLegend": True,
          "thickness": 20,
          "type": "Default"
        },
        "ProteinA": {
          "color": "green",
          "position": "top",
          "thickness": 45,
          "type": "Line"
        }
      },
      "varOverlays": ["ProteinA", "-", "GeneClass"],
      "varTitleLabelPosition": "bottom",
      "variablesClustered": True,
      "xAxis": ["Var1", "Var2", "Var3", "Var4", "Var5", "Var6", "Var7", "Var8", "Var9", "Var10", "Var11", "Var12", "Var13", "Var14", "Var15", "Var16", "Var17", "Var18", "Var19", "Var20"]
    },
    width = 600,
    height = 400
  )
)